

Necessary Evil: Visas part II
So, I decided to investigate and inform some of my questions from Visas part I and here is how I did it.
I extracted the following freely available data on passport strength: the Henley Passport Index (HPI, June 2026) and the Arton Passport Index visa matrix (January 2025). I used the HPI as my main endpoint and Arton as a sensitivity check — to see whether the results generally held when measured against a similar but parallel outcome.
I then downloaded Economist Intelligence Unit (EIU) Democracy Index data to capture each country’s type of governance. For development metrics, I obtained the United Nations Development Programme (UNDP) Human Development Index (HDI, 2025) and World Bank GDP per capita (2024).
For education metrics, I used UNESCO Institute for Statistics (UIS) data on adult literacy, education expenditure as a percentage of government expenditure, and functional literacy/numeracy proficiency.
I also extracted, to the best of my ability, diplomacy data from the Lowy Institute (for only 65 countries), along with conflict and violence data from the Uppsala Conflict Data Program (UCDP) one-sided violence dataset (v26.1), which records civilian killings by governments and armed groups (1989–2025).
I then used Claude’s powerful Opus 4.8 model to clean, tabulate, organize, and process the data, testing my various questions (framed as formal hypotheses) through Claude’s built-in Python capability. Throughout, I used its “Project” function to upload the datasets I had manually extracted, and I gave Claude a standardized set of instructions in the settings to emphasize critical thinking, to challenge the assumptions I was bound to make (as a human), and to rate its degree of confidence in every response, so that I could serve as a manual safety and accuracy check.
I have provided the exact instructions and prompts, the final refined spreadsheet, and the final processed report that Claude generated in the “Appendix” at the end of this blog, so that anyone who wants to try it for themselves can reproduce the process. And I welcome any constructive feedback and corrections, provided people explain the rationale and show me how to do things right. But read with skepticism — that is a healthy and entirely reasonable state of mind. Don’t assume any of this is reality; treat it as an attempt to understand what the data shows.
Visualizing the data…
If you’re from a country with GDP per capita below $5,000, the chance of traveling visa-free to at least 50 countries is roughly two-thirds (67%) — not as bad as I’d expected. But raise the bar to the median Henley score of 82 (visa-free access to at least 82 destinations) and the probability collapses to about 8% (Fig. 1). And if your country is low-income — GDP per capita below $1,146 — the chance of reaching 82 is essentially zero: not one low-income country in the data clears the median. So if you dream of becoming a travel vlogger and you live in Malawi (passport: ~70 destinations) or Nepal (~35), the math is brutal — real access, but never into the upper half of global mobility. Your alternative is to leave everything behind, emigrate to a country with a stronger passport, contribute to its economy for years, and eventually naturalize. By then, the vlogging dream may already be sidelined. Imagine the friction, and the struggle.
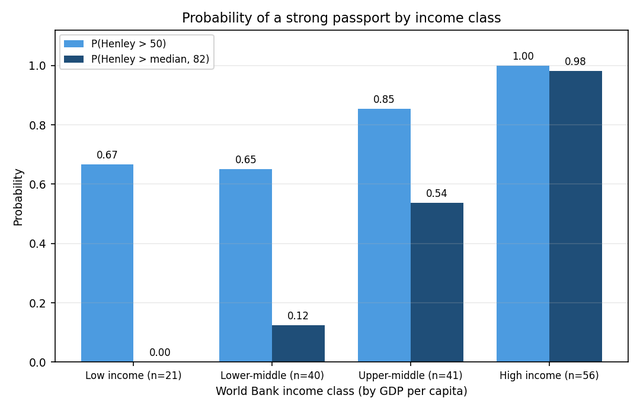
Fig. 1, Probability of a strong passport by income class, at two thresholds. The dark bars (above-median) reveal income as a near-prerequisite for upper-half mobility. P = probability. Henley = Henley passport index. GDP = gross domestic product.
A major counterargument is that if travel, border, and immigration restrictions were lifted, people would disproportionately “swarm” economically well-off places and ultimately damage their social fabric. It sounds sound, but it lacks historical and anthropological context. Where are most people actually heading, and what is their historical relationship to those destinations? What is the trend — people from historical colonizer nations moving toward previously colonized ones, or the other way around?
I divided the data from 159 countries into four major categories.
- Major colonizers — 10 countries — United Kingdom, France, Spain, Portugal, Netherlands, Belgium, Germany, Italy, Russia, and Japan
- Minor colonizers — 5 countries that held colonies of limited scope or duration — Denmark, Sweden, Norway, Australia, and the United States
- Never colonized — retained sovereignty throughout the colonial era — 7 countries — Thailand, Iran, China, Nepal, Bhutan, Ethiopia, and Liberia.
- Colonized — colonized by the major or minor colonizers — all other 137 countries
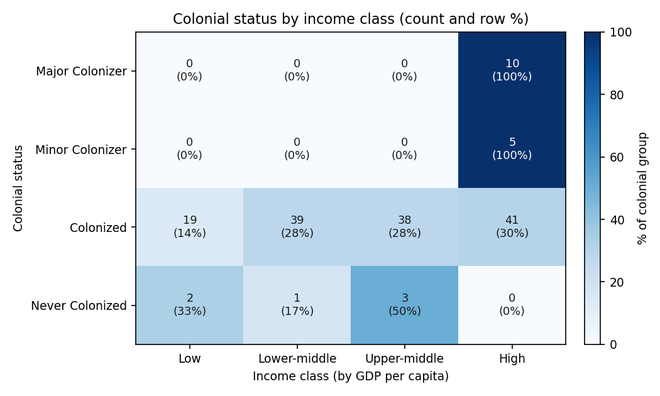
Fig. 2, Colonial status by income class (count and row %). The complete concentration of colonizers in the high-income tier is the clearest illustration of why colonial status and wealth cannot be separated in this data.
The data (Fig. 2) shows that all 10 major colonizers and all 5 minor colonizers fall into the high-income category by GDP per capita. Some previously colonized nations did emerge from poverty — 41 of 137 are now high-income — but that is only about 30% of all colonized countries. The average GDP per capita came out to roughly $58,000 for major and minor colonizers, $15,511 for colonized nations (skewed below the median, as most colonized nations remain poor), and even lower, $4,879, for never-colonized nations (similarly skewed, as most in this group are poor too). This reflects the obvious point that colonizers grew historically wealthy from the spoils of colonization — always at the expense of some other group.
Now look at Fig. 3. On average, the major and minor colonizer nations have the strongest passports, well ahead of the colonized and never-colonized groups. The only real exception among the never-colonized nations is Thailand (Henley 77). This partly makes sense: colonized nations suffered resource extraction, political instability, and regional conflict as direct and indirect results of colonization, which helps explain why most remain poor. The never-colonized nations look, at first glance, like a problem for the colonization hypothesis — they were never colonized, yet they have the weakest passports of all. But this is really the wealth confound at work: 6 out of these 7 nations are among the poorest in the data, and passport strength tracks wealth. Beyond that, in a world that was overwhelmingly colonized, these “never-colonized” states were effectively islands in a sea of colonies and may have had to compromise on trade and borders in ways that disadvantage them to this day.
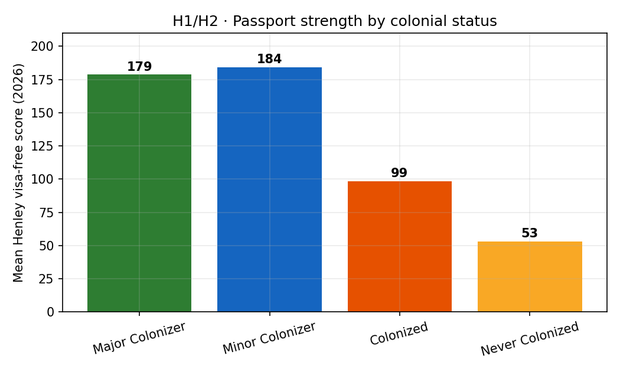
Fig. 3, Mean passport strength by colonial classification. Note that 'Never Colonized' is lowest, signaling confounding with wealth.
One thing that was expected from the start, and that the data reproduced, is that a nation’s GDP per capita (along with collinear variables like the Human Development Index or HDI) correlates very strongly with Henley passport strength (Figs. 4 and 5). GDP per capita and HDI could, on their own, predict a country’s passport ranking. This was robust: it held even when I used the Arton Passport Index (see appendix). You can see how the colonizer nations cluster in the top right of the chart, and how most points fall close to the dotted fit line — the signature of a strong correlation. This doesn’t take much effort to grasp, but I find that looking at the data paints a sharper picture than intuition alone.
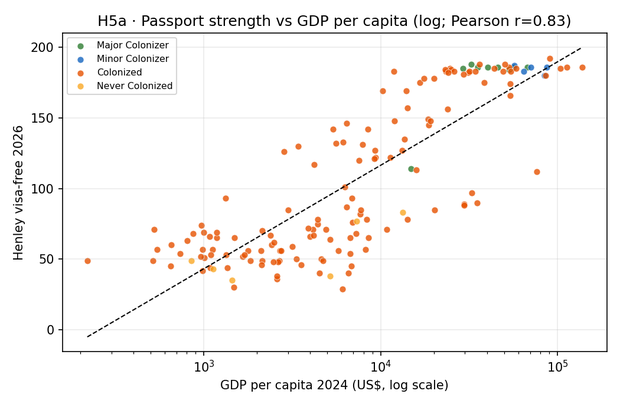
Fig. 4, GDP per-capita against passport strength. Colour denotes colonial status; dashed line is the fit
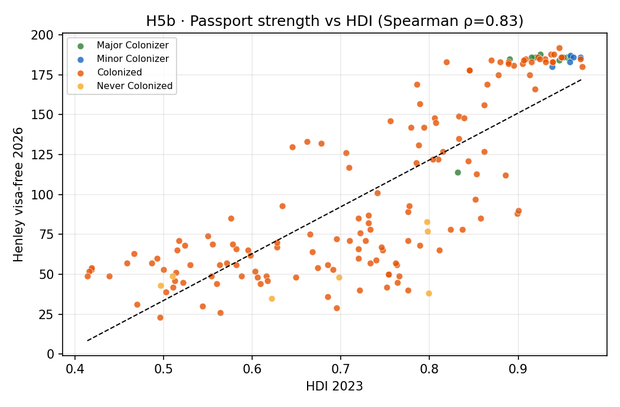
Fig. 5, Human Development Index (HDI) against passport strength. Colour denotes colonial status; dashed line is the fit
I found similar correlations between passport strength and both education and violence, detailed in the appendix. This is unsurprising: poorer countries tend to have lower education indices and higher rates of violence, both of which track with weaker passports. I also found that the more democratic a nation (by the EIU Democracy Index), the stronger its passport (Fig. 6). That makes sense, since richer countries tend to have better development and education metrics, freer presses, and stronger democracies. There were exceptions — wealthy authoritarian states with strong passports — but the data leaned toward democracy. I’d caution against over-reading this: passport strength correlates with wealth, and democracy travels with wealth, so we can’t conclude that democracy itself makes passports stronger. Ironically, most major and minor colonizers had stronger democracies than the nations they colonized.
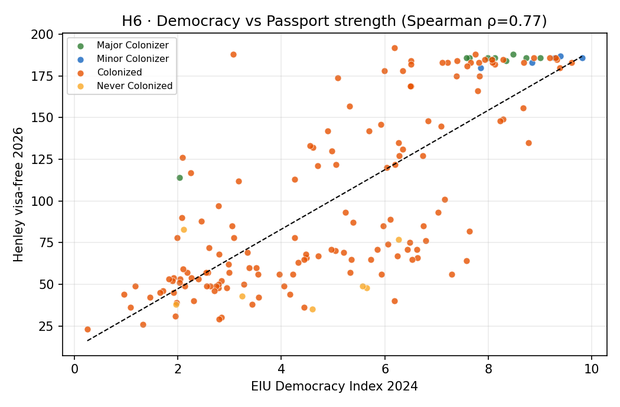
Fig. 6, Democracy index against passport strength, colored by colonial status.
A surprising finding was that education spending as a share of total government spending correlated negatively with wealth, and therefore with passport strength. This held across both IMF and UNESCO datasets. I would guess that poorer countries devote a larger share of their budgets to education but spend it less efficiently, whereas richer countries spend a smaller share more efficiently and supplement it with substantial private and non-governmental investment. The divide becomes stark when you narrow the comparison to OECD versus non-OECD nations (Fig. 7). OECD members, for the unfamiliar, tend to be wealthier economies with free-trade agreements and stronger education standards.
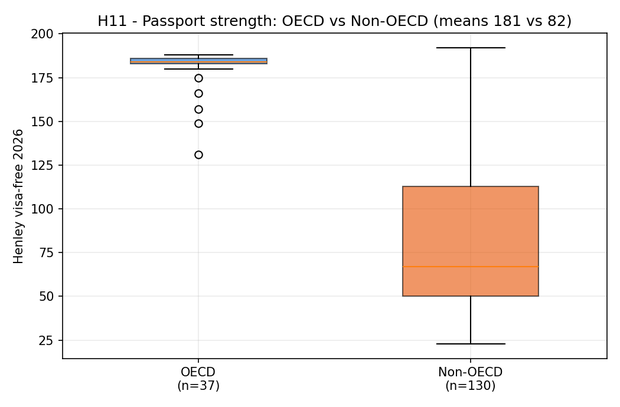
Fig. 7, Distribution of passport strength, OECD versus non-OECD. The median gap approaches one hundred destinations.
Another interesting finding underscored the role of geopolitics. In Fig. 8, countries like Iraq, Vietnam, Turkmenistan, Sri Lanka, Iran, Armenia, Saudi Arabia, and Bahrain have surprisingly weaker passports than the model would predict from their development alone. Either their international standing or global perception is poor (e.g., Saudi Arabia), or they are under some form of sanction (e.g., Iran).
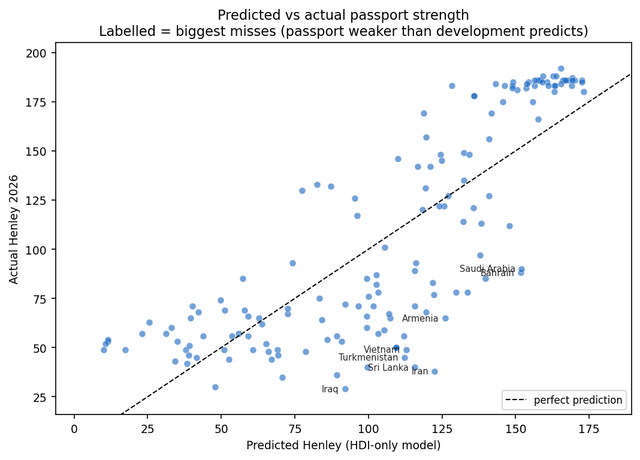
Fig. 8, Predicted versus actual passport strength (HDI-only model). Labelled points fall far below the line — passports weaker than development predicts, almost all sanctioned or geopolitically constrained states
What surprised me most was that diplomatic effort didn’t really correlate with passport strength, contrary to what I had assumed. You can see this in Fig. 9: the points scatter away from the fit line, whereas clustering near it would have indicated a correlation. I’d take this with a grain of salt, though, since there is no clean way to “measure” diplomacy in the first place.
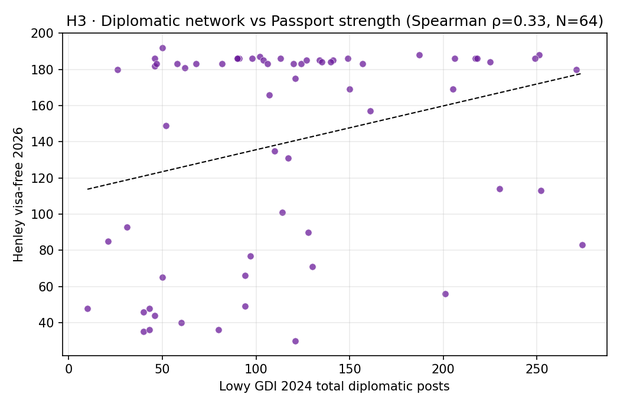
Fig. 9, Diplomatic network compared with passport strength. Based on Lowy Global Diplomatic Index (GDI) 2024.
If you are interested in other metrics that were analyzed, please look at the report provided through the appendix.
Conclusion
So the richer countries, many of them historical colonizers, hold the strongest passports. The rest of the world holds relatively weaker ones, with a few exceptions and outliers like Singapore. Bringing population data into the picture makes the figures even more striking. It turns out that roughly 73% of the world’s population — about 3 in 4 people — live in countries whose passports cannot reach more than half the world’s destinations. Put differently, 73% of the world lives in countries with a Henley score below 98; only about 1 in 4 people, or 27% of the world, can technically travel the globe with relative ease.
But remember, all of this is based on national data and does not necessarily apply to any given individual. A working-class person from the United States might visit fewer destinations in their lifetime than an educated, privileged person from Nepal like me. But it also means that, by accident of birth, that American could easily out-travel me if they had the means and the will — because they would be far less likely to face the enormous layers of bureaucracy behind visas. They would also have avoided the 25-hour Incheon sleepover I didn’t.
This is why any reasonable person would empathize with the 73% who are travel-restricted in one way or another. Humans have always moved — through countless waves of migration and shifting population dynamics across millennia — and that movement shaped the world we live in. Countries and nations would never have existed had people stayed confined to sub-Saharan Africa or Central Asia. So I would ask: what, then, is the point of clinging to national identities so dearly, especially for politically invisible nations such as Nepal? National identity may carry some benefits by fostering ethnic and linguistic cohesion, but at what cost, and to what end? What has it really changed for us in the larger context of geopolitics? It seems that countries like ours simply need to be richer to improve their citizens’ global mobility — but that is far easier said than done when most people cannot even travel freely enough to build the trade and business relationships that would generate that wealth in the first place.
Think about it this way: how reasonable would it be to require citizens to carry passports just to travel between districts or cities within their own country? Imagine the friction, and the disparities in quality of life. By that logic, someone from Kathmandu could move freely across more than half of Nepal while someone of equal economic standing from Surkhet could not. How absurd would it sound for a New Yorker to need a passport to visit New Jersey or California? So how are nations really any different from cities when it comes to travel and migration? And if they are different, why do unions like the EU and the Schengen Area exist at all? I hold the radical view that visas, and the deliberate bureaucratic walls behind them, run against human nature. I tend to see them as an under-reported form of human rights violation, precisely because they fail to account for the moral failures of colonization and the asymmetrical resource extraction carried out by a powerful minority.
You may argue that my position is idealistic — that, for instance, Indians and Pakistanis, or North and South Koreans, could never travel freely across their borders. But consider: would those divisions even exist in a world without colonization or the Cold War? Where, then, does the moral responsibility to repair the world lie? When and how would former colonizers pay reparations? I would encourage an empathetic sense of historical responsibility among people in colonizer nations, directed toward improving global mobility. Their politicians are not doing the world a favor by “letting in” immigrants — they have a serious and urgent moral obligation to do so. And when the charge arises that “immigrants” are destroying some “cultural fabric” — a popular right-wing refrain in rich nations — people should ask what happened to the cultural fabric of the 73% who can no longer reach more than half the globe, on top of bearing countless other consequences of colonization. I therefore think that restrictive visas exist mostly because of xenophobic policies disguised as pragmatism.